National Aeronautics and Space Administration
Marshall Space Flight Center
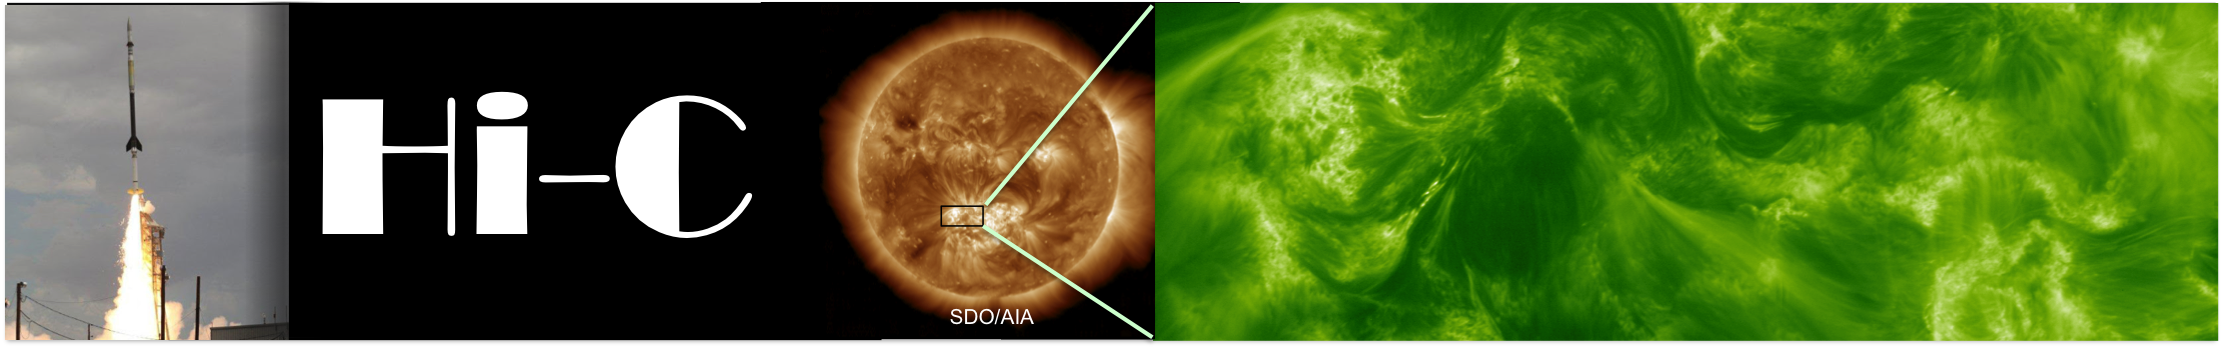
Hi-C
Gallery
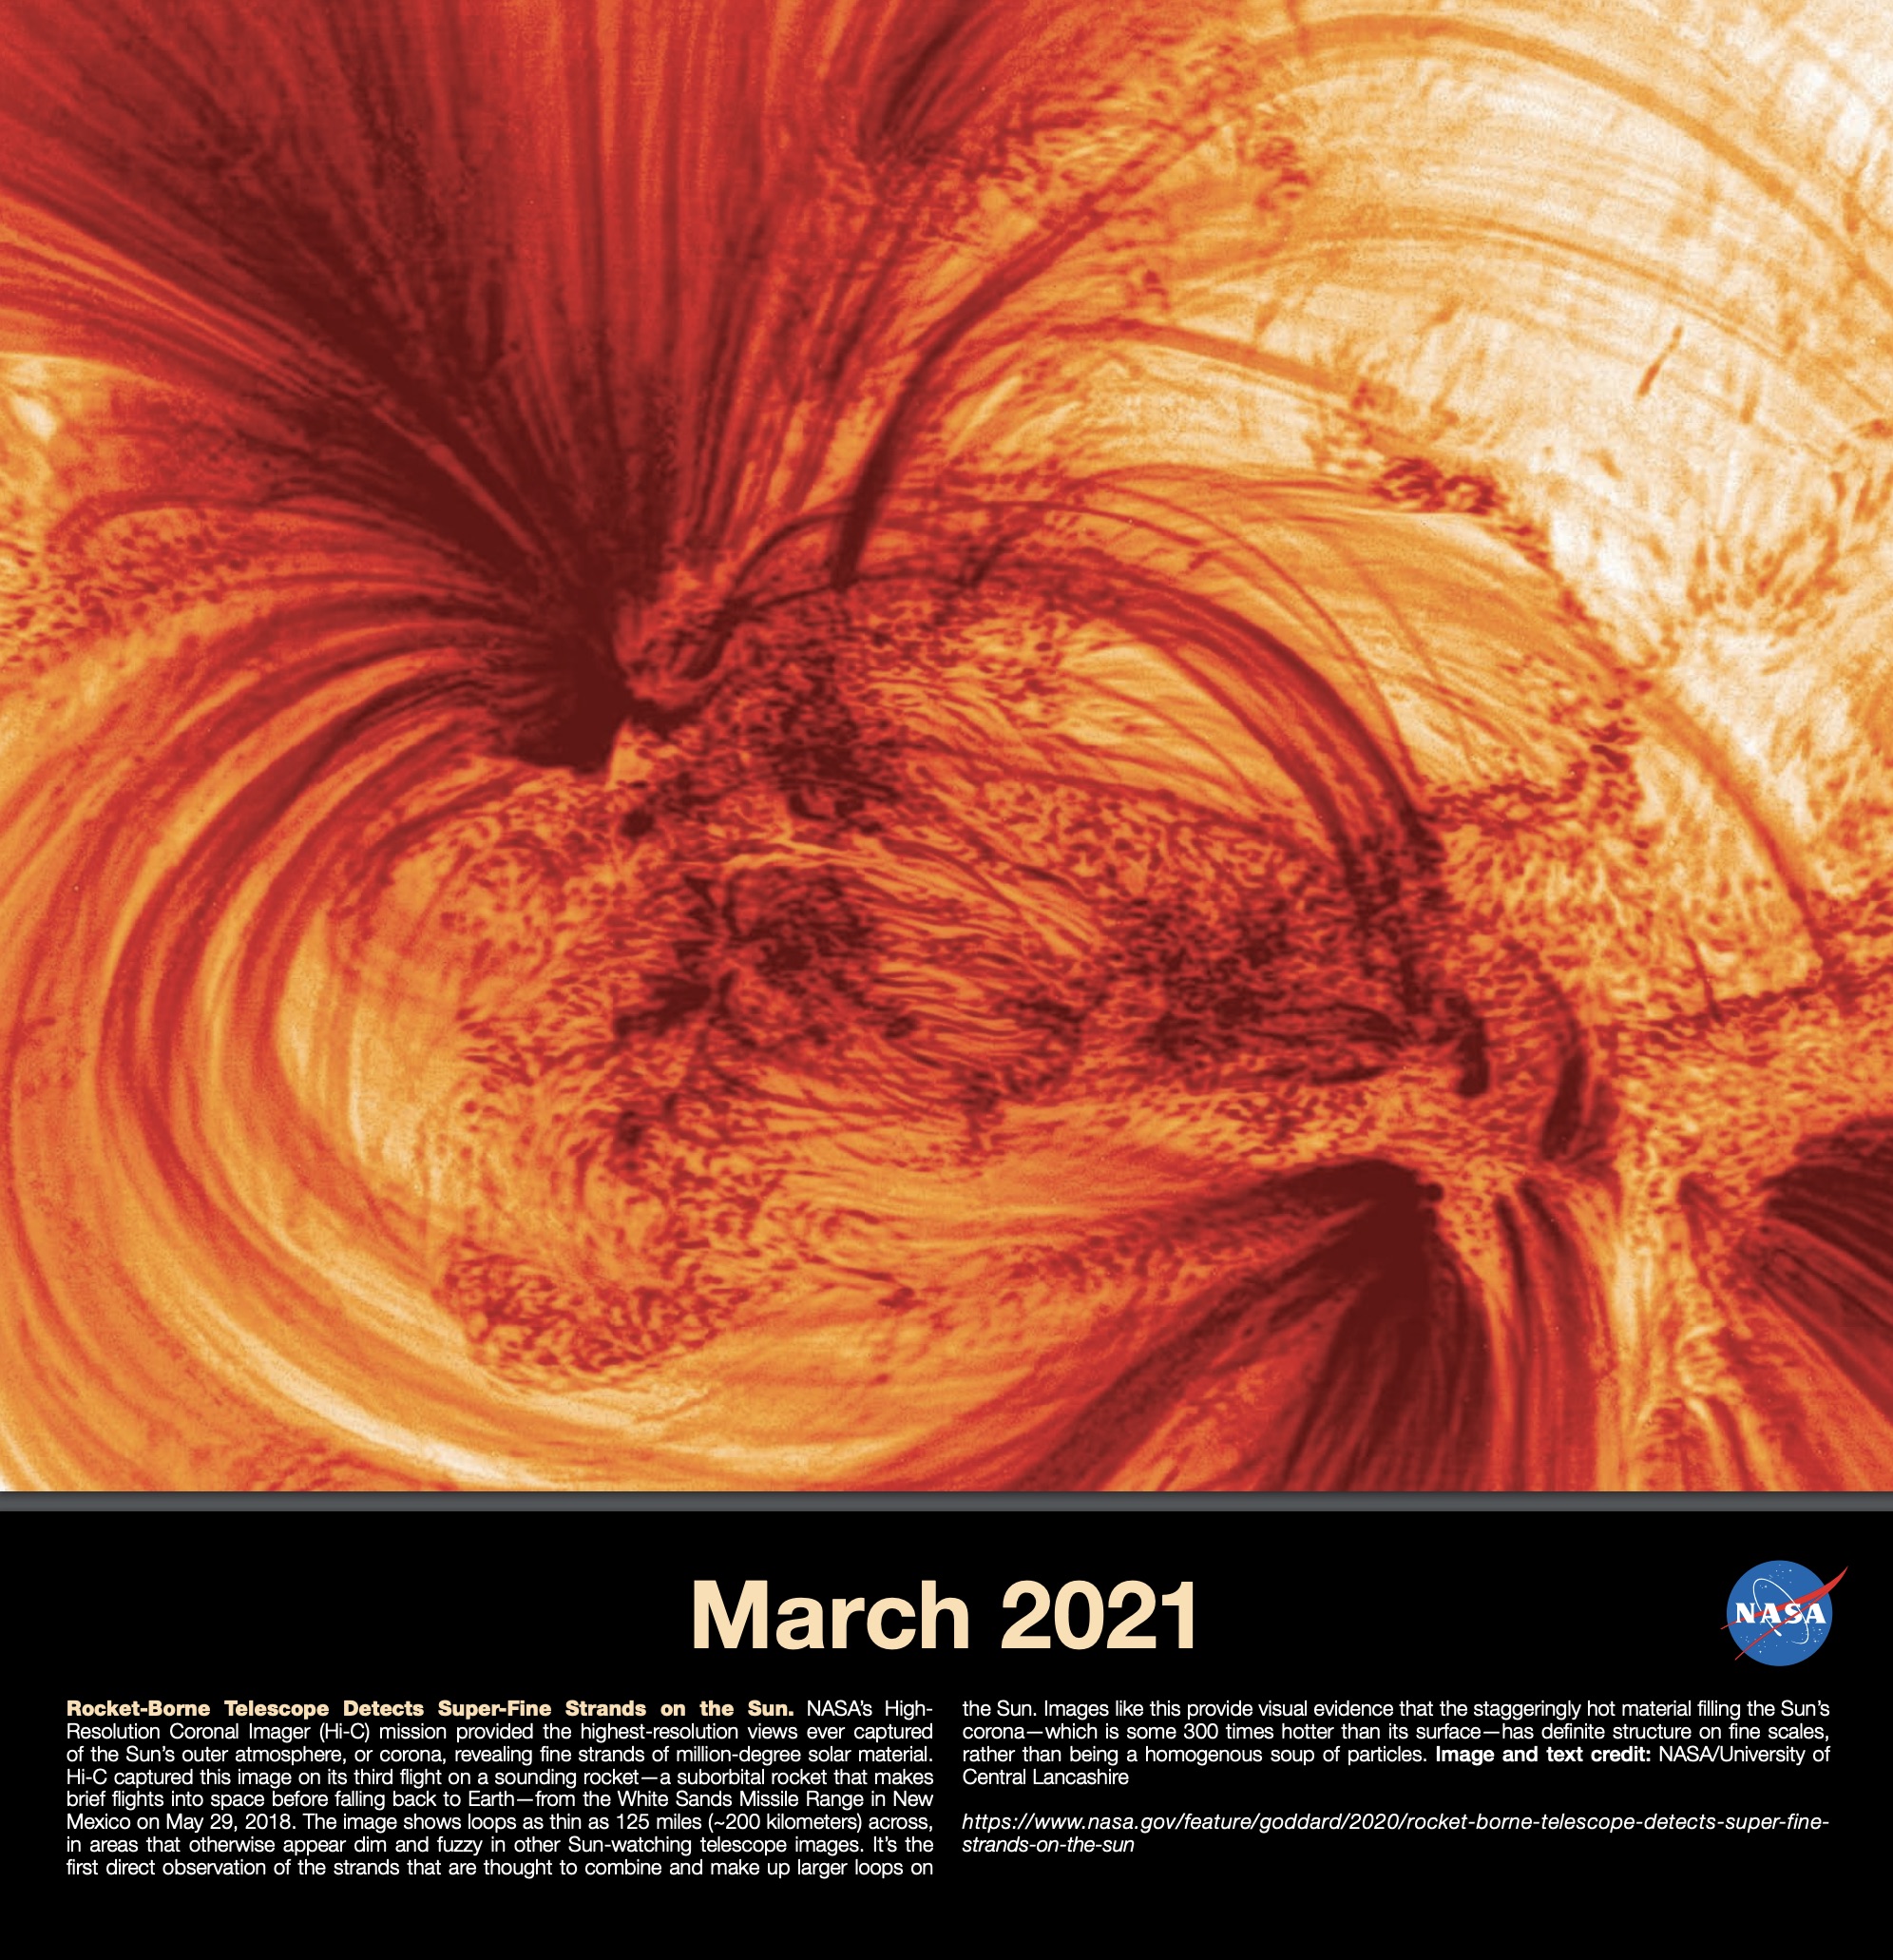
Image Credit: NASA [MSFC/GSFC]/SAO
2020 NASA Explore Science Planning Guide
Hi-C 2.1 image highlighted in March of the 2021 NASA calendar.
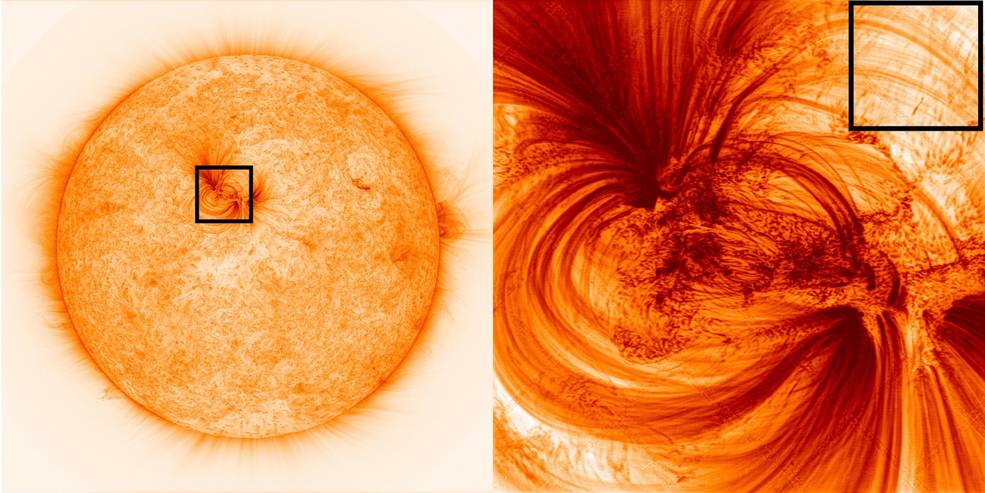
Image Credit: NASA [MSFC]/UCLAN/SAO: Hi-C 2.1 strands
Hi-C 2.1 strands: Reference Williams et al. 2020, ApJ
The Hi-C telescope zoomed in on Active Region 12712, capturing fine threads of solar material.

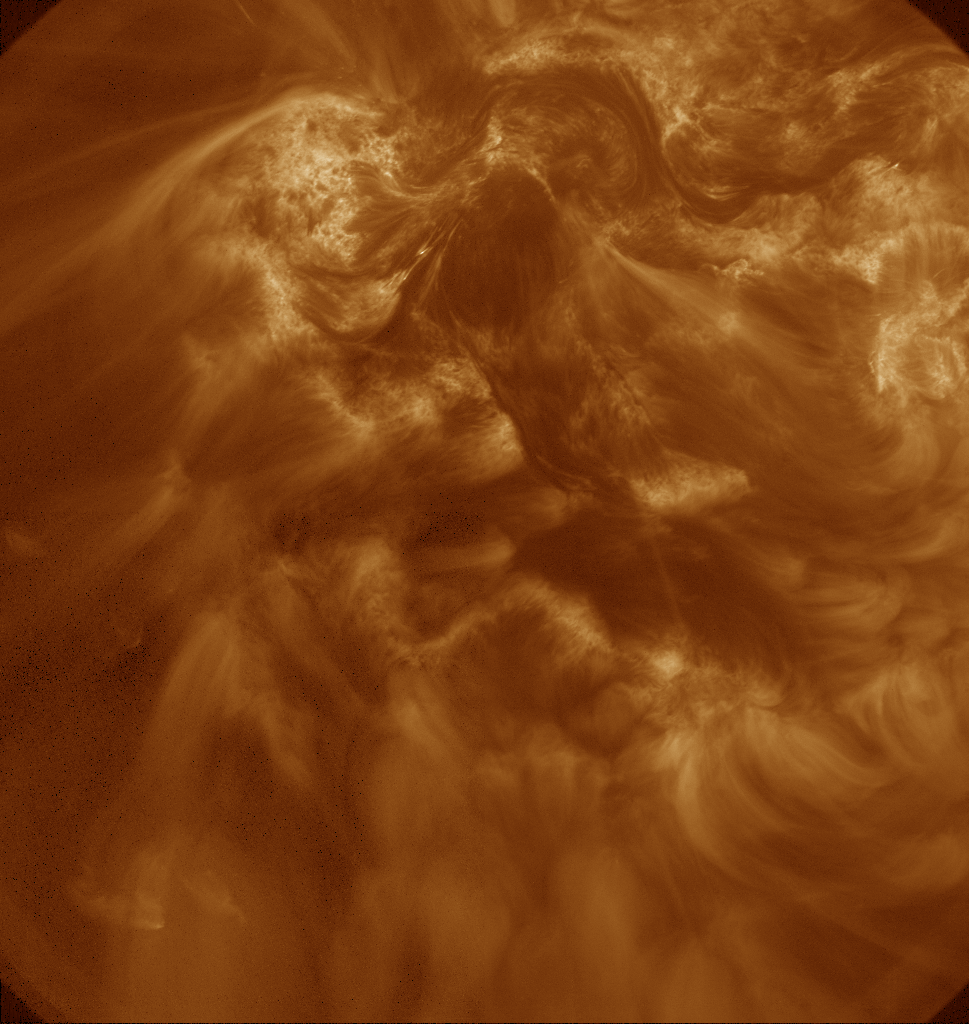
Image Credit: NASA [MSFC]/SAO: Hi-C 2.1
Hi-C 2.1 172 Å Full Field of View (Sharpened)
(Comparison to SDO/AIA provided on home page.)
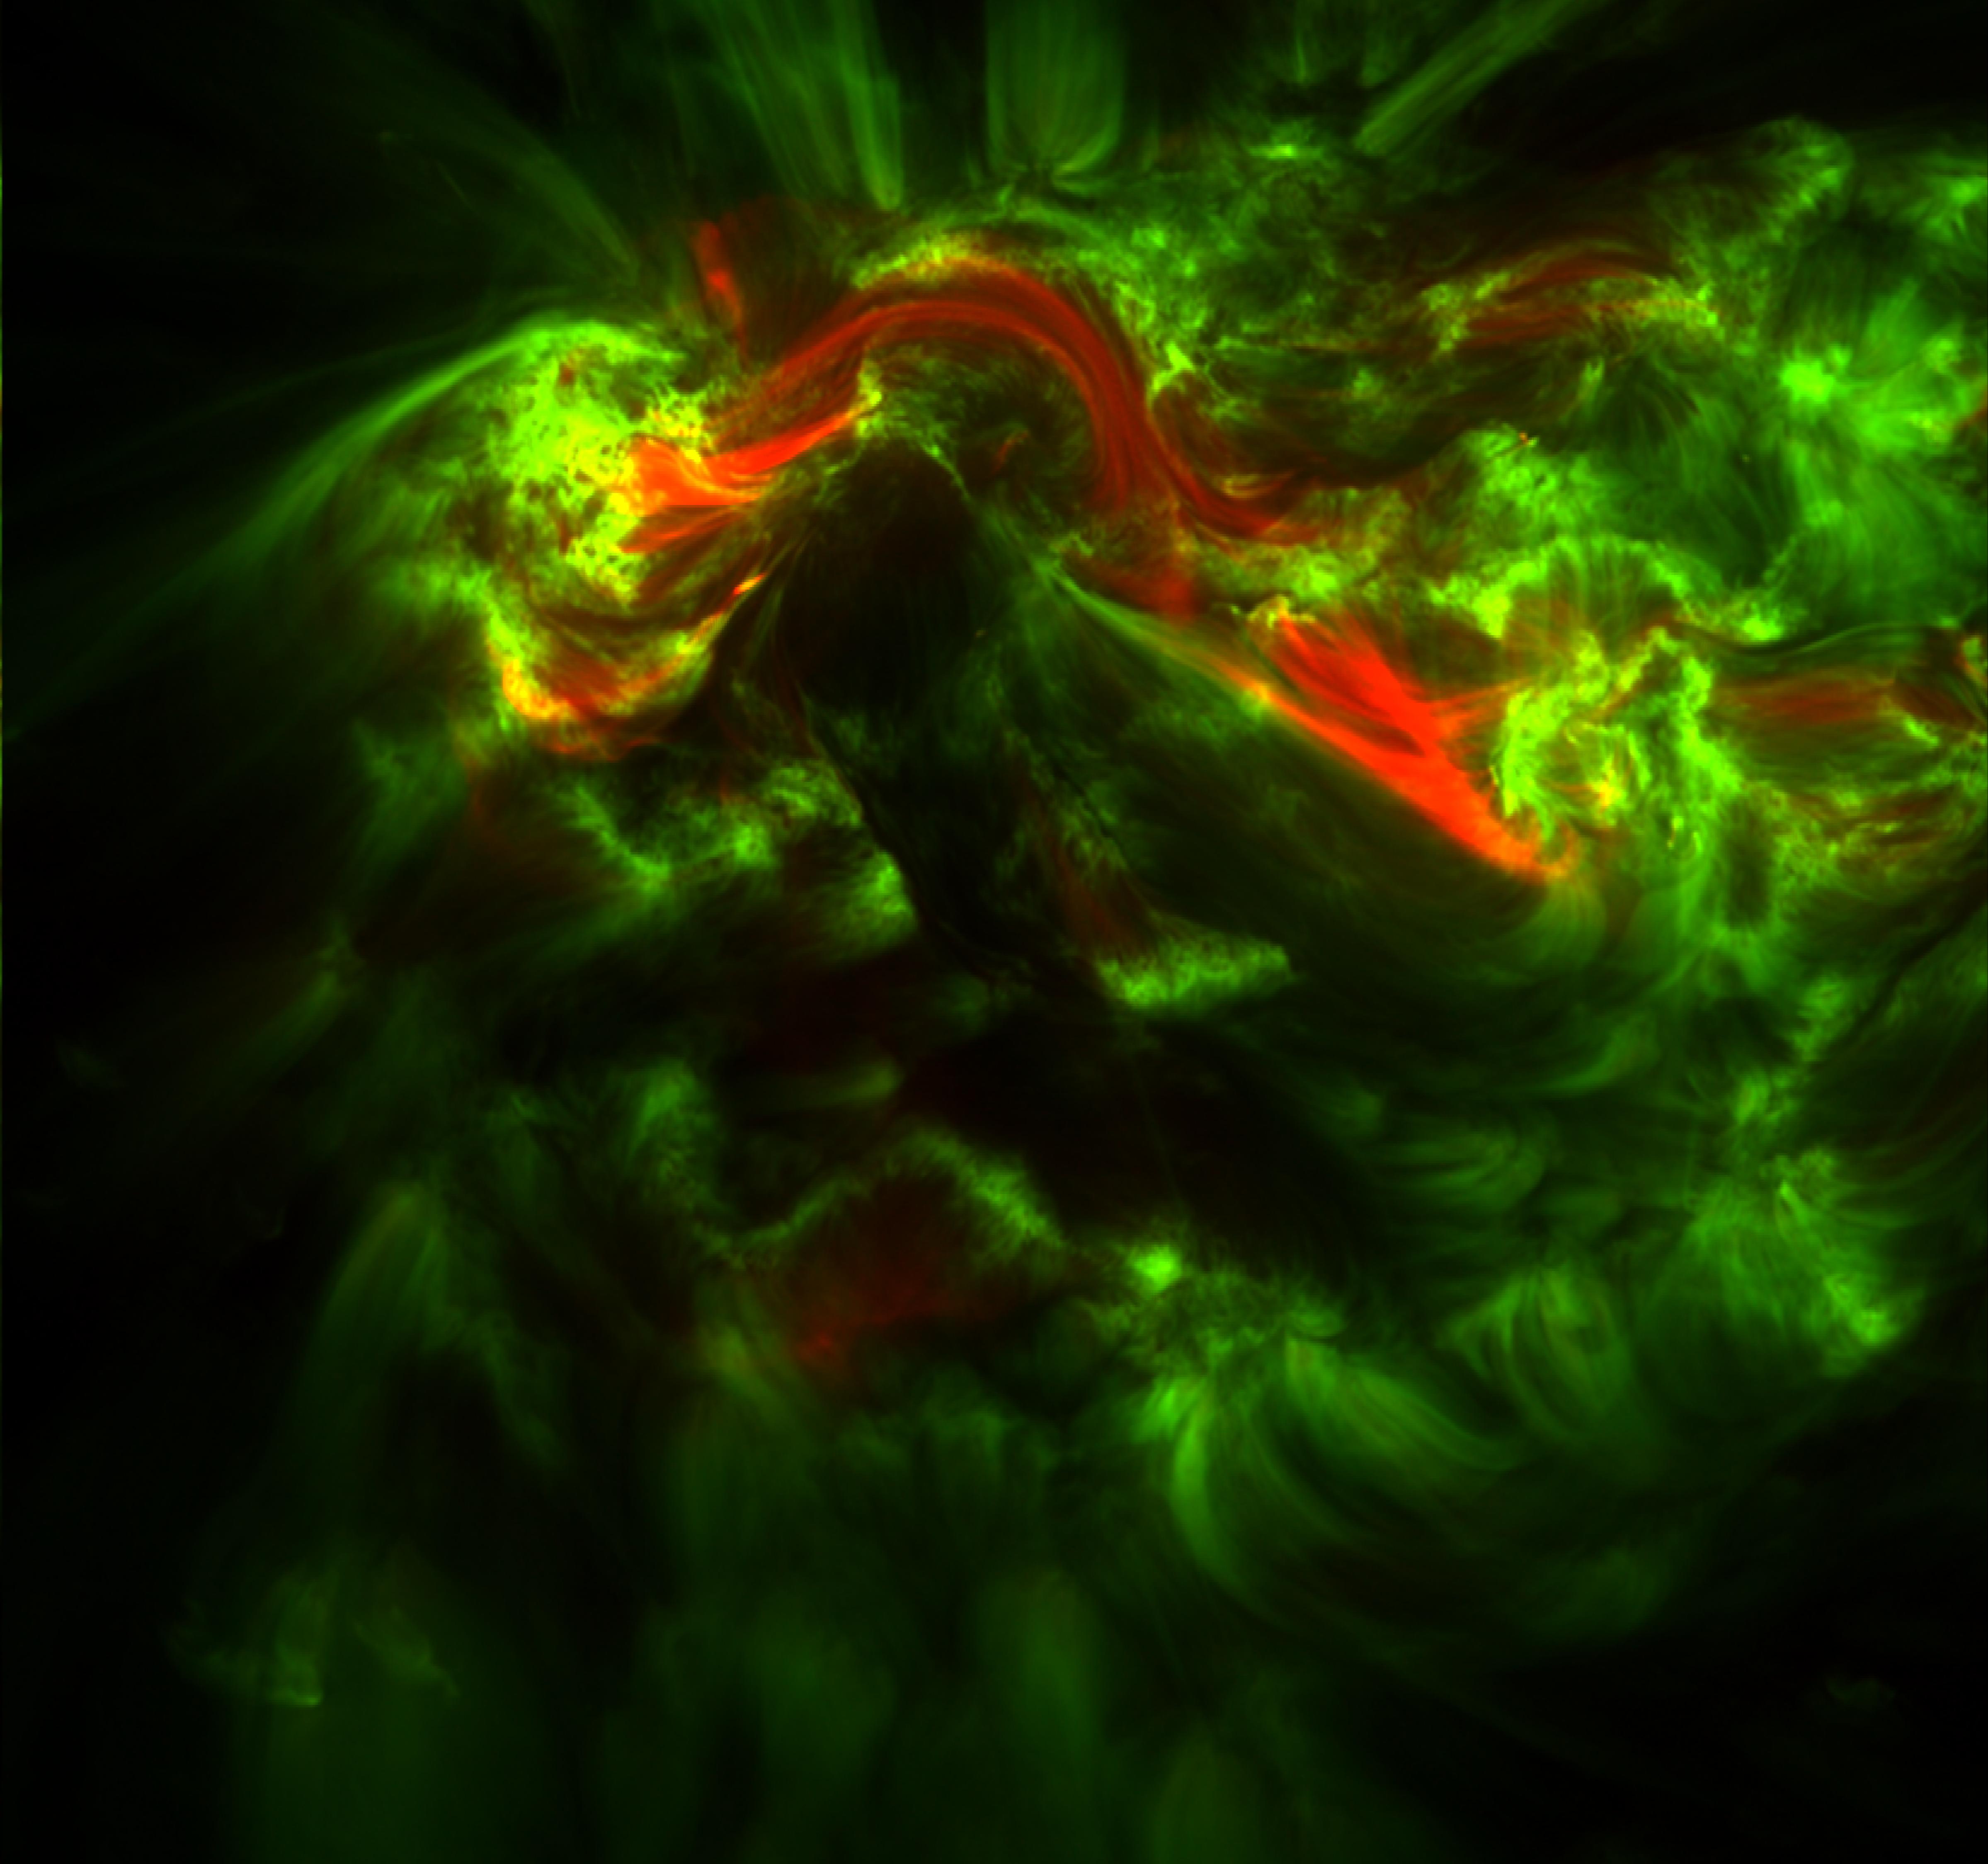
Image Credit: NASA [MSFC/GSFC]/SAO: Hi-C 1 & SDO/AIA
Hi-C 1 193 Å Field of View
AIA 193 Å (green) overlayed with AIA 94 Å emission (red).
Movie Credit: NASA [MSFC/GSFC]/SAO: Hi-C 1 & SDO/AIA
Evolving Loops: Reference Winebarger et al., 2013 ApJ
MOV — (7 MB) or (1 MB)
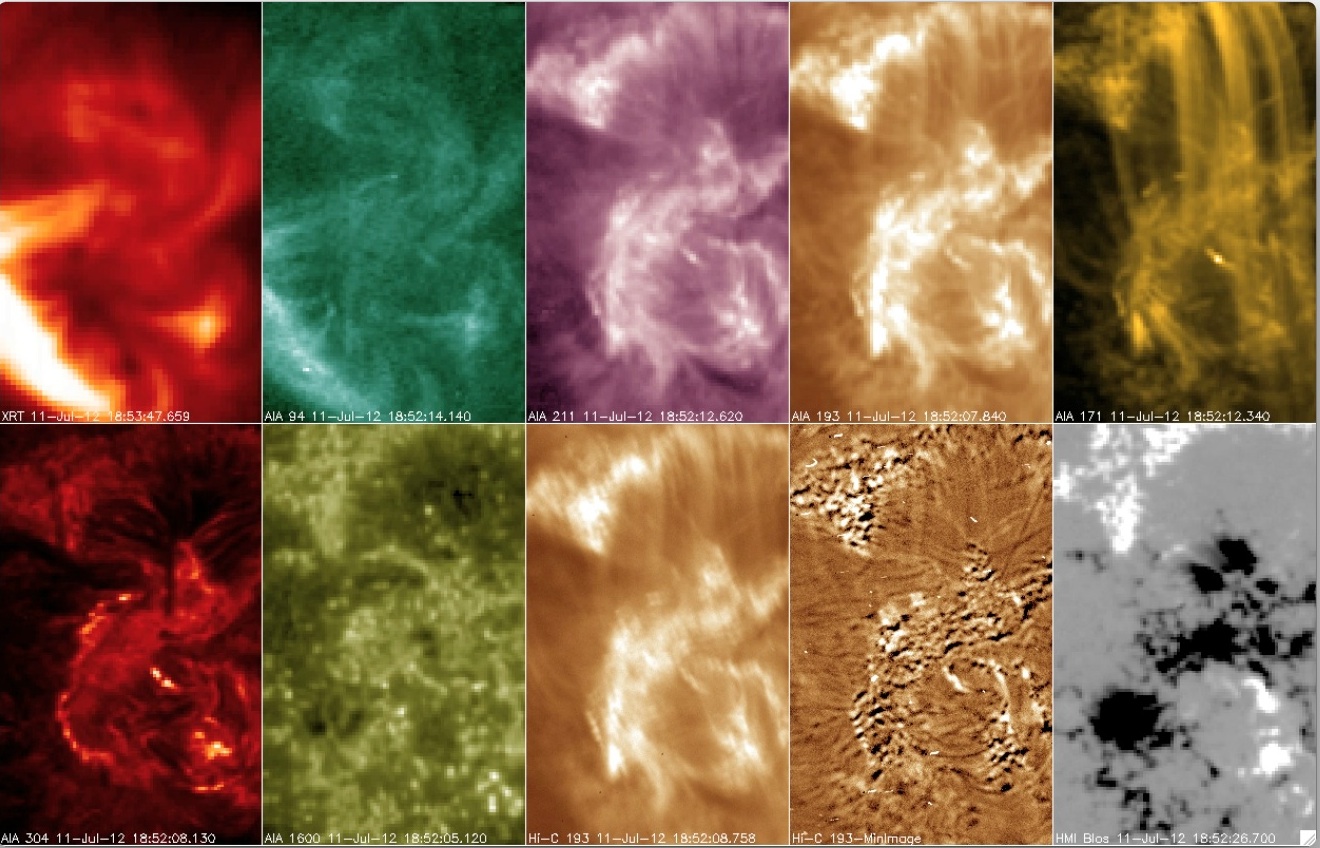
Comprehensive movie depicting the evolution of a set of loops in X-rays from Hinode/XRT (corona), in several extreme ultraviolet bandpasses from SDO/AIA & Hi-C 1 (corona), and in AIA's
1600 Å channel (upper photosphere). The final panel shows the underlying magnetic field configuration from SDO/HMI.
Movie Credit: NASA [MSFC/GSFC]/SAO: Hi-C 1 & SDO/AIA
Unbraiding
MOV — (5 MB) or (1 MB)
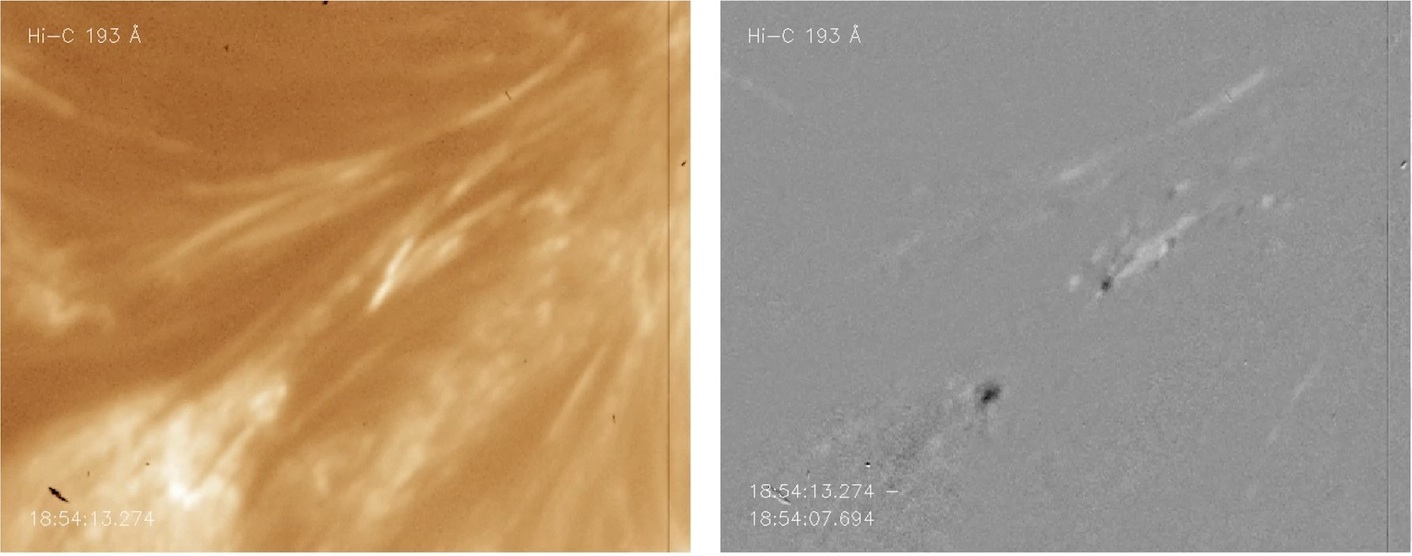
The relatively small region of interest in this movie contains a set of loops which appear to unbraid (i.e., unwrap about a common axis), which
is subsequently followed by intense brightening. The left panel shows the original Hi-C 1 193 Å and AIA 193 Å data; the right panel shows a running difference movie. Magnetic
reconnection at an apparent X-point (where the fields cross) can be inferred from these observations: The black and white ''streaks'' in the running difference movie imply strong flows
away from the X-point which is indicative of magnetic reconnection.
A more detailed description of these observations is the focus of a Nature
article. [Cirtain et al. 2013, Nature, Vol. 493, No. 7433, pp 501-503]
Movie Credit: NASA [MSFC/GSFC]/SAO: Hi-C 1 & SDO/AIA
Hi-C 1 Field of View Evolution in SDO/AIA
MOV — (28 MB) or (5 MB)
M4V — (20 MB) or (4 MB)
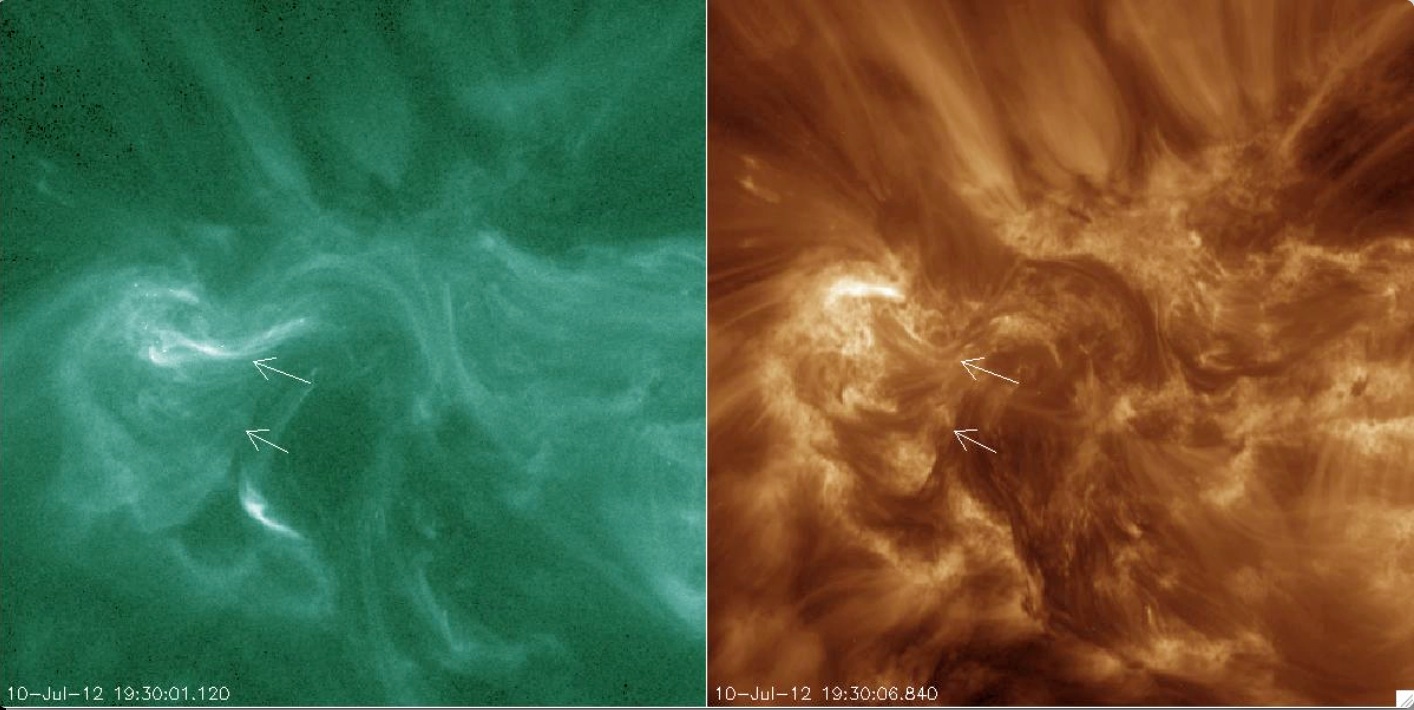
Evolution of the Hi-C field of view as seen in the SDO/AIA 94 Å (left) and 193 Å (right) channels. The movie starts approximately one day before the Hi-C launch and ends
approximately one day after. The arrows point out particular regions of interest
discussed in Hi-C's Nature article. [Cirtain et al. 2013, Nature, Vol. 493, No. 7433, pp 501-503]

- NASA Contact: Sabrina Savage
- Page Last Updated: Tuesday, 17 November 2020